

Bitcoin’s uptrend stepped off the gas this week, losing $200 in a couple of days. This is how we could have predicted the pullback, like I did 3 days ago.
We need to take a look at the 4-hour chart of Bitcoin.
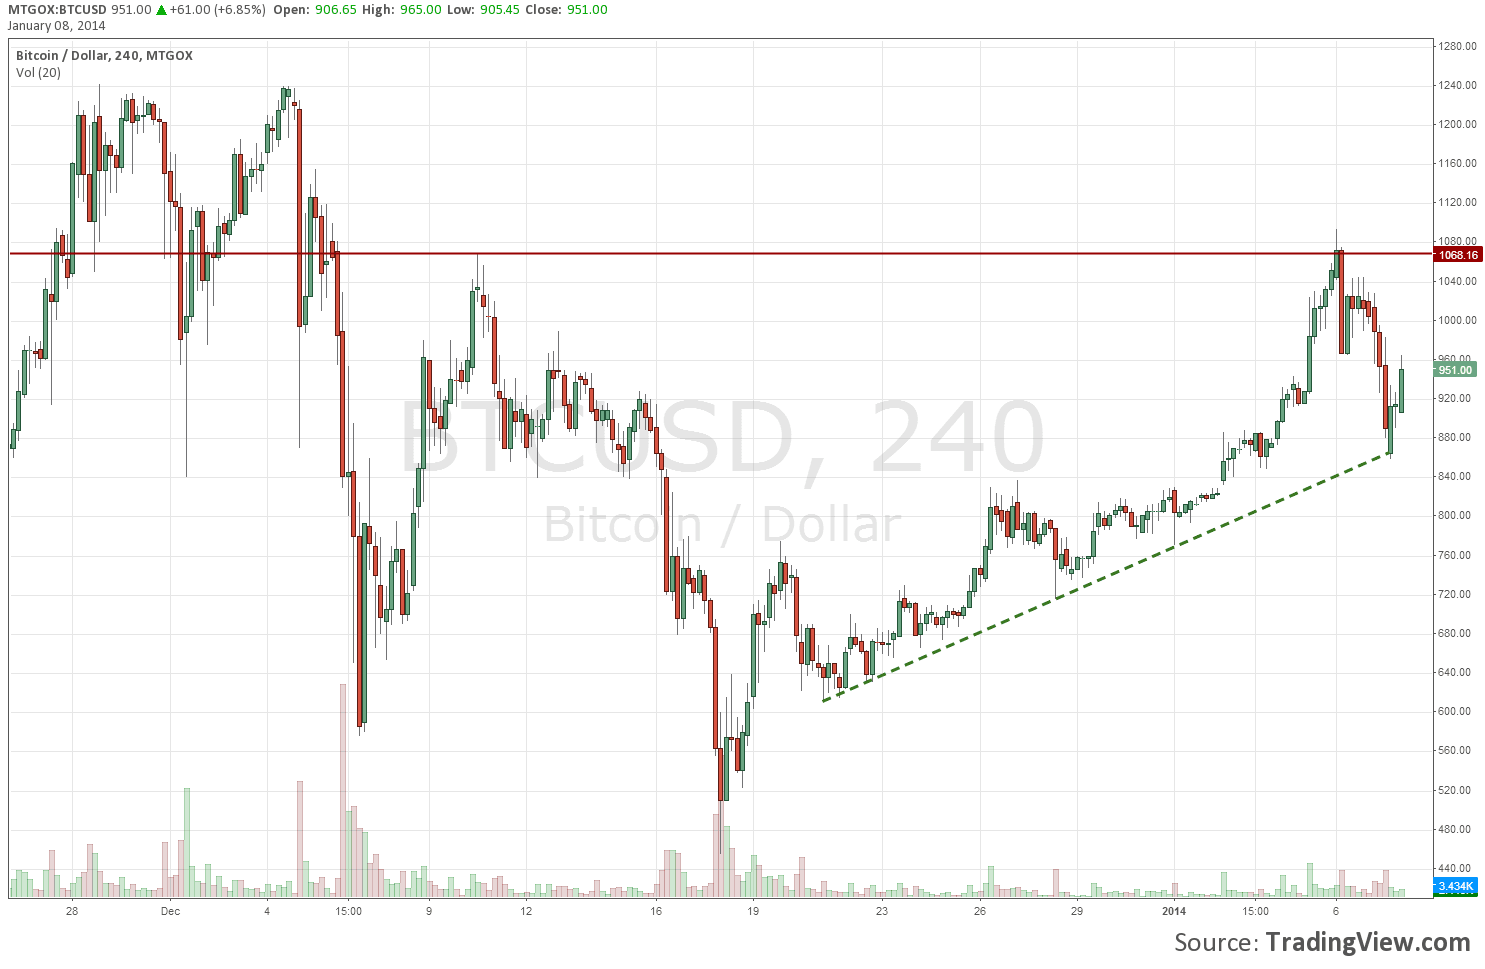
On December 10, Bitcoin met resistance close to the $1,080 mark. The doji candlestick indicated that traders were looking for direction. The market was confused whether the surge from $600 would keep up, or it was time for a retracement. Hours later it was decided: retracement it was!
Bitcoin lost $600 in the following 10 days! That was $100 or so lower than the previous support level. A sign that means the crypto-currency might be trending downwards. Yes, even now that it is trading for around a thousand dollars!
Yet, it never retested the support level since then. It continually printed new higher highs and lows, steadily climbing the ascending trend line.
What do we make from all this? Bitcoin is in a short-term uptrend.
By looking at the big picture though, there is evidence that Bitcoin might have entered a consolidation phase. We now have two points that confirm both support and resistance. Thus, perhaps that short-term uptrend is about to end, capturing a lot of Bitcoin advocators.
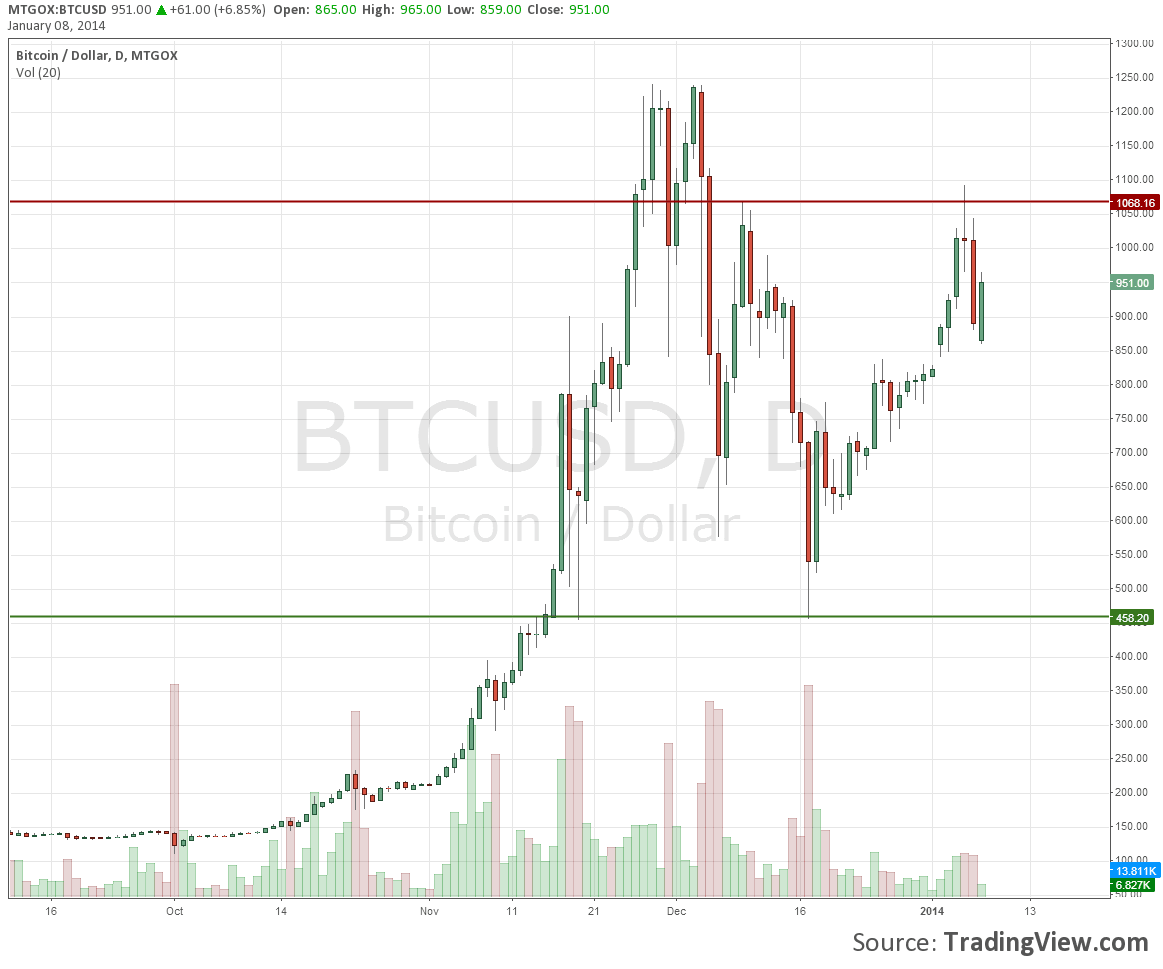
This consolidation of course may just be acting as a preparation for the next surge to $1,500 or $2,000! Maybe the resistance level will fail much sooner than expected. Still, as long as that resistance is holding up, I will reconsider buying Bitcoins only if they are sold for $500 or so. In other words, if Bitcoin price pulls back to the key support level.
Well, how could we have predicted that Bitcoin’s uptrend would lose speed at that point?
Isn’t obvious at this point? Bitcoin had met resistance at that price area 8 days before it printed a new lower low (I’m talking of the December price action). It would take a lot of buying power to overcome that obstacle, coming all the way from down there ($450).
So, next time you get stuck looking at 5-min or 30-min charts to discover hidden levels for a reversal, remember to check out longer timeframes. I have found those seemingly slow-paced charts very helpful, when trying to find a spot to take profits or go against the trend. And we need all the help we can get when thinking of not following the trend!

