

As Twitter stock price is moving up into uncharted territory, these are two likely profit targets to trade out; $66 and $73.50.
Why there?
I have used the 1-hour chart of Twitter stock, in order to:
- Measure the range of last week’s pullback; and
- Draw the 161.8% Fibonacci Extension level.
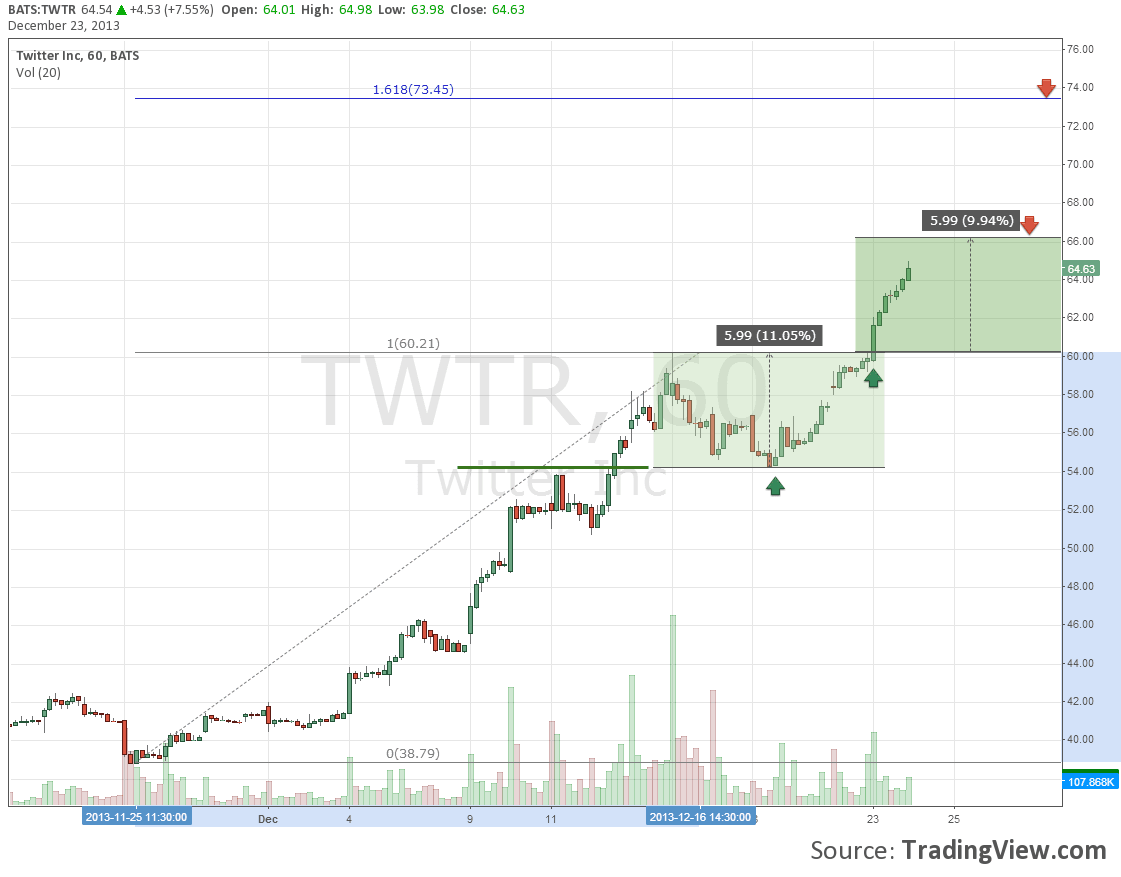
Bulls had control of the market on Monday (that’s yesterday) since the market’s open. Note the bullish candlestick that was printed during the first hour (exactly at the second green arrow; we’ll talk about it later). That particular candlestick would have been an excellent entry point due to the concurrent breakout (new high as well).
Some traders may have already been long at $54, when Twitter share price pulled back to the previous resistance level.
Either way, the goal now is to find the next profit target.
Obviously I am not suggesting going short at any one of those levels. During an uptrend, I’ll always be looking to follow the trend by entering during a pullback.
Thus, like any other trader who is long Twitter, I’m looking to trade out somewhere.
Trading range: How to use it in your technical analysis
Adding the pullback’s range (6 dollars) on top of the most recent resistance level will show how much higher Twitter stock price can climb. As long as next trading range is similar to the previous one, the uptrend might meet resistance at $66.20.
Apparently resistance doesn’t necessarily mean the trend’s end. It’s just that the stock price’s rally might slow down there. And when a trend steps off the gas, it’s a good point to take profits.
But that’s not the whole story.
If you have been following me at Google+, you would have known that I’m an advocate of Fibonacci retracements and extensions. 2 weeks ago I discussed about the imminent rise of Twitter stock price and used Fibonacci extensions. Back then, the 261.8% Fibonacci extension was placed at $67.50, quite close with the first profit target I’m talking today due to the trading range.
Check out how that prediction turned out at my TradingView chart (hint: click “play”).
[box type=”info”]Remember, support and resistance levels aren’t exact numbers rather than areas where price is expecting to find support or meet resistance.[/box]
Therefore, two distinct Fibonacci extensions are coinciding between $66 and $67.50. With no other signs at those unknown waters for Twitter, I would exit 50% of my position right there, depending on the price action at the 15-minute chart.
New 161.8% Fibonacci extension at $73.50 for Twitter stock
For this new Fibonacci extension I have used the uptrend since the all-time low at $39 up to the recent high at $60. 161.8% Fibonacci extension goes as far as $73.50 and that’s where I would trade out 30% more of my position and let the remaining of my position open.
At the same time I’m moving up my stop loss (probably placed below the low of the long green bullish candlestick at the 1-hour chart) to the breakeven point, so that I don’t lose money in this trade. More risk-averse traders may have opted for a stop loss below $54, but that would seriously hurt the risk/reward ratio. We talked about that yesterday when we analyzed the Apple stock chart as they announced the deal with China Mobile.
In brief, there have been two excellent opportunities to trade long Twitter stock, indicated with green arrows at the chart above. Furthermore, profit targets can be set with the help of both the trading range and Fibonacci extensions.
Do you use Fibonacci extensions in your technical analysis? Everyone is talking about the Twitter bubble; is it a bubble after all? Let me know in the comments below.

