

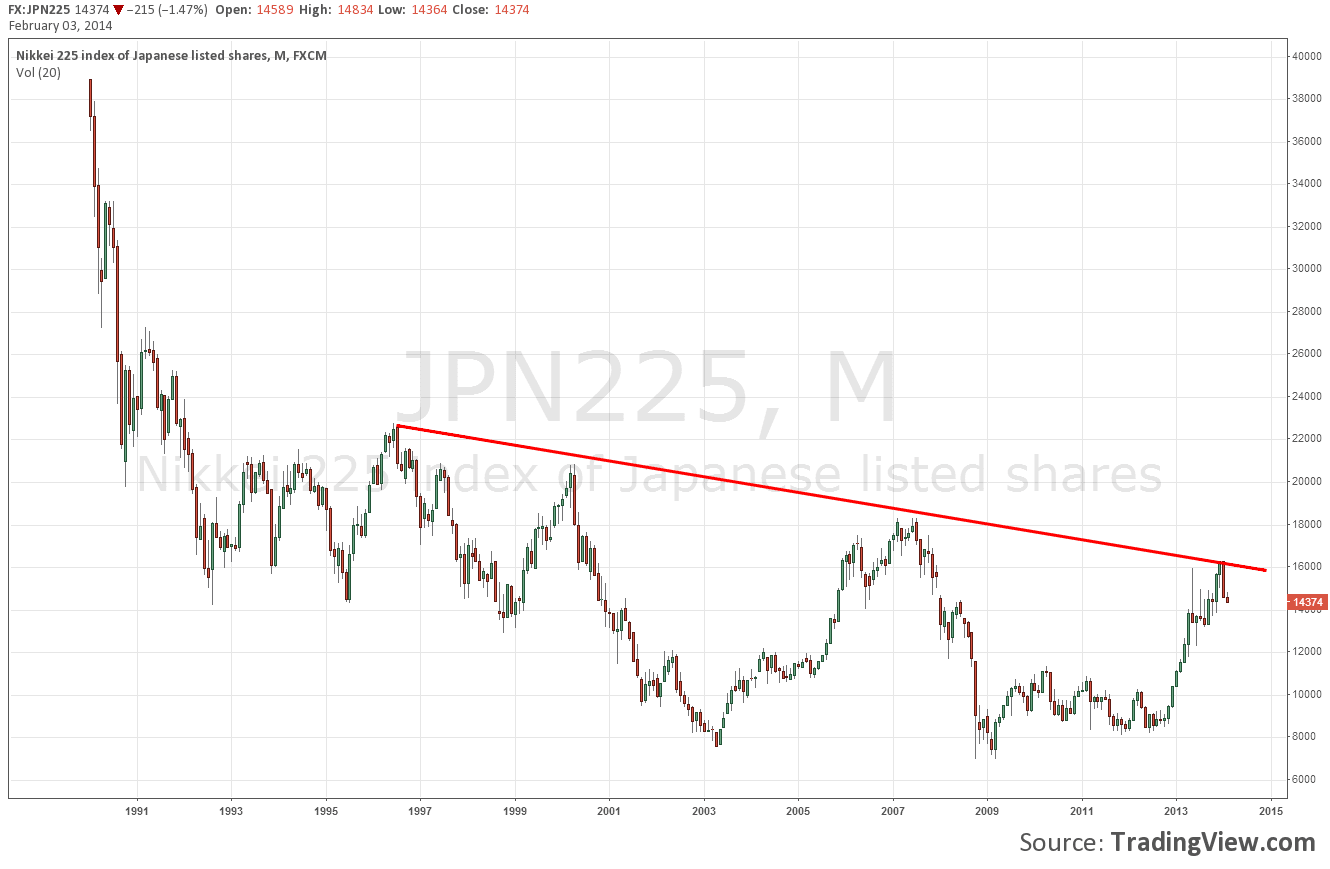
Bloomberg, MarketWatch and BusinessInsider have it all wrong! Nikkei 225 has not officially entered correction. Japan’s index is simply resuming its 20-year downtrend! Yet, they (and you) need getting rid of the daily chart and move over to the Nikkei’s monthly chart. Ah, yes, it is now much clearer.
It was not that difficult to load the monthly chart and back up my opinion, was it? So, why most financial news sites acknowledge Nikkei’s movement as correction? Because, technically speaking a correction is widely considered as the reverse movement, usually negative, of at least 10% in a stock, bond or index to adjust for an overvaluation (Investopedia). That is exactly what Nikkei 225 index is doing in 2014, dropping 10% from the previous peak.
Still, it is not the only reason for media to ignore monthly or yearly activity. Daily charts are much ‘faster’ that monthly charts. Thus, daily charts are much more popular to recreational traders and investors. People, who are unfamiliar with online trading and looking to invest some of their savings, expect results quickly. Investing today and taking profits in a month or two sounds nice, but investing today and taking profits in a year or two, not so much.
So, why should they care looking at monthly charts? First, there is also a small chance they do not even know monthly charts actually exist! Even when I began studying the markets many years ago, I myself only paid attention to the daily charts. No one had told me the importance of different timeframes and to trust established trends on longer timeframes, instead of looking at the market’s small picture.
Therefore, they need to start looking at the big picture. Nikkei’s big picture shows a well-defined decline. The easy-to-draw trendline has now been confirmed for the fourth time! It is not a weak confirmation either, given the strong bearish January’s candlestick.
On the other hand, the double bottom (2003 and 2009 bottoms) may be regarded as the likely termination of the downtrend. Having said that, Nikkei might actually not fall below 8,000 again. Moreover, the Japanese index may also find support at 7,000 once more just as easily as penetrating the support level. See? It is too early to draw safe conclusions about what will happen at that point.
Personally speaking, the most reliable technical signal remains the declining trendline with a lot of space for the index to continue falling. The line also serves for setting stop loss orders. What comes down must go up!
Now that traders have analyzed the 20-year Nikkei index activity, it is indeed time to get down to the daily chart and comment on the so-called, Nikkei’s ‘correction’.
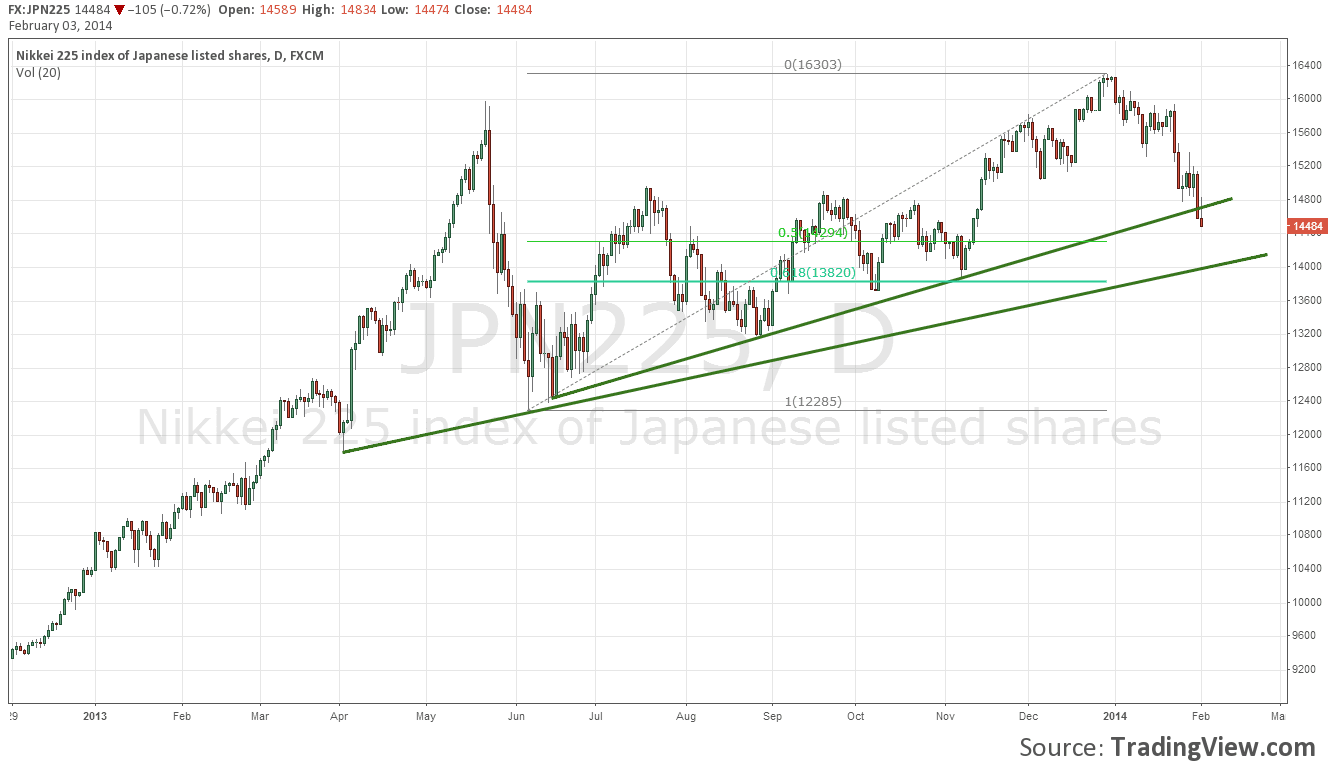
Japanese stocks’ drop has put Nikkei in technical correction according to MarketWatch. While one of the most profound ascending trendlines has failed, another one is still valid. Concurrently, Nikkei is about 1,000 points higher than the 61.8% Fibonacci retracement level, which can also provide support.
Sure, Nikkei is trending up and is just correcting itself. Nevertheless, if I were going to trust these signals at the daily chart, I would move down to the hourly or 15-min chart to trade the index. In case of index trading on the daily chart though, I would seriously consider the monthly activity and wait for an entry to go short!
Summing it all up:
- Nikkei 225 correction: I look for long entry points based on Fibonacci retracements and the ascending trendline. I move down to the 30-min Nikkei chart and pinpoint my entry by waiting for bullish candlestick patterns happening close to those lines. I use daily chart’s formations to set my stop loss and profit targets. I totally ignore monthly action!
- Nikkei 225 downtrend: I look for short entry points at the daily chart like the bearish candlestick on the very first trading day of 2014, so that I follow the monthly trend (yes, it is too late now for that, unless index climbs all the way up there again!). Under today’s circumstances, I will patiently wait for Nikkei index to print a new lower peak at around 16,000 or somewhat lower. Unsurprisingly I will use the monthly chart to set my stop loss and profit targets.
Will Nikkei resume trending downwards, or is it really a correction and Japan index will continue trending up, possibly penetrating the resistance level at 16,300 (breakout at the monthly chart)? Let me know what you think in the comments below.

