

High-profile companies reported their quarterly earnings on Thursday. Most posted better than expected earnings. Still, there were exceptions, Expedia being one of them. Let’s see what technical analysis can predict for their price action following the reports.
1. Activision Blizzard
That was another successful quarter for Activision Blizzard. Yet, the earnings’ surprise might not be enough for ATVI stock price to break out above the $22 level. Shares have been on the rise since mid-January. But they are now trading inside a strong resistance zone.
61.8% Fibonacci level is nearby at $21.70, adding more selling pressure to the stock.
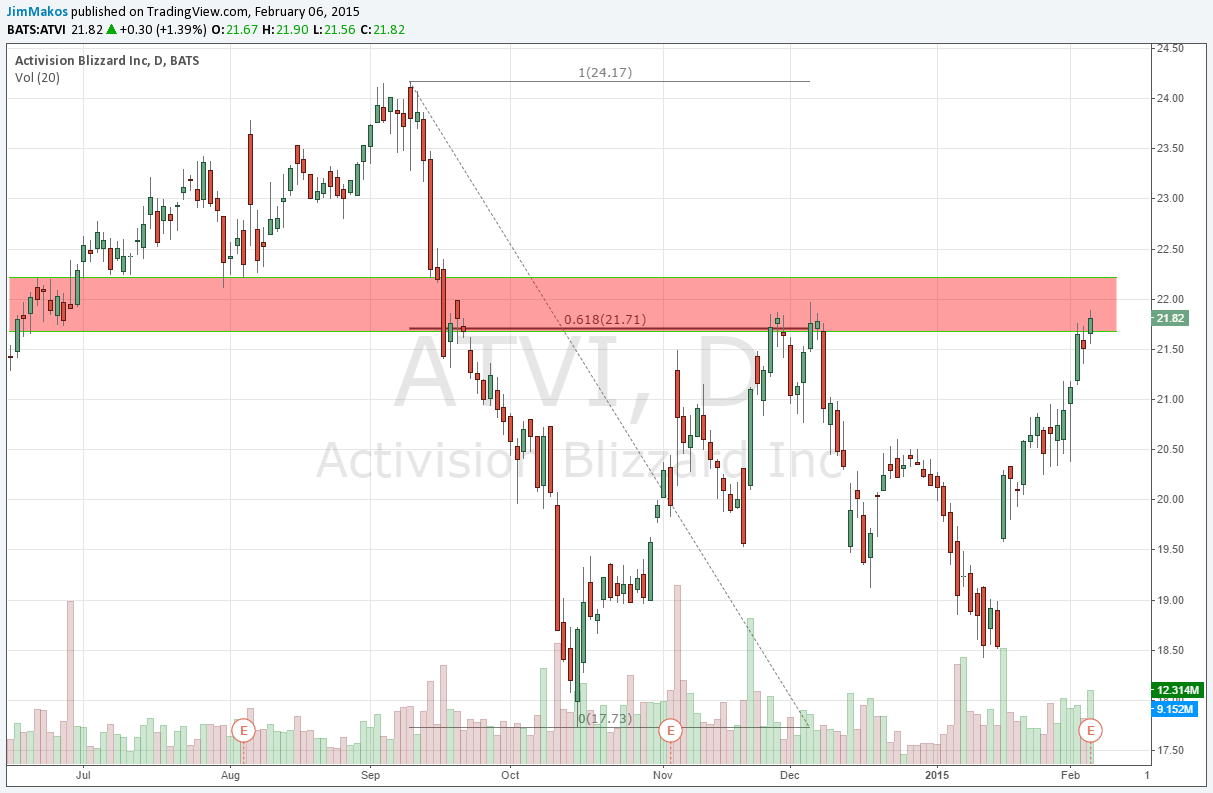
How I’d trade ATVI stock: Selling short at $22 and setting a tight stop loss of half a dollar. I’d set the profit target at recent low of $18.50, hoping to hit a 7:1 risk/reward trade!
2. Expedia
Next up, Expedia posted a lower-than-expected EPS of $0.86 (estimate $1.02). EXPE shares traded inside the resistance zone on Thursday, likely favoring bearish positions. Now that the report is out, buyers would have more trouble to push the price above $89.

How I’d trade EXPE stock: Again, I’d opt for a short selling position. In fact, I’m betting on the continuation of the ranging market. Entry price is $88 with one dollar stop loss, aiming for a downfall towards eighty-two dollars. If successful, the reward would be six-fold the risk.
3. LinkedIn
Another company that surprised with their earnings. LinkedIn shares are trading at key resistance level. That is still lower that the all-time high. I’d bet on breaking out and testing those highs over the next week. Yet, I’d avoid trading this stock, due to the low-reward/high-risk conditions.
4. Twitter
Twitter earnings beat estimates, yet only for 6 cents. Currently, Twitter shares are trading at a key resistance/previous support level. I’d be surprised if there’s enough bullish sentiment to overcome the resistance.
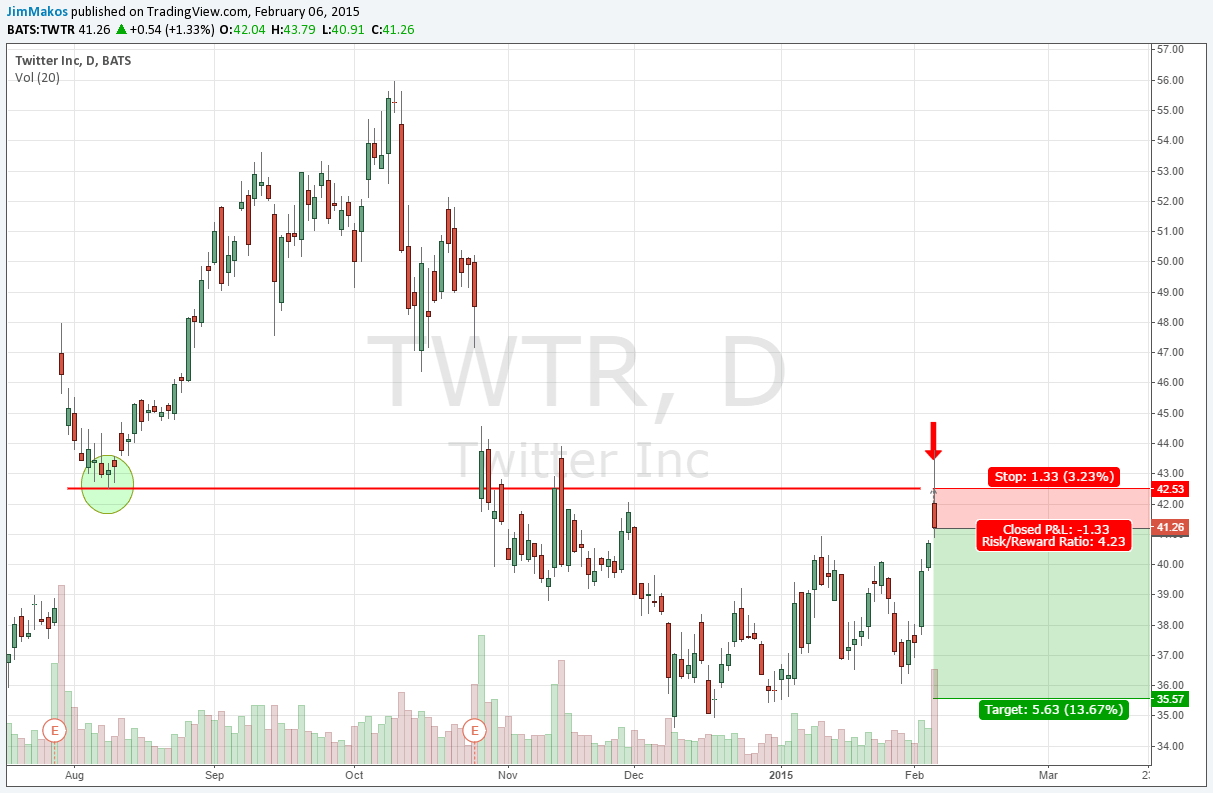
How I’d trade Twitter: I posted my prediction yesterday at TradingView. Check out my analysis at the chart I shared.
5. Yelp
Yelp earnings were almost in line with estimates. Traders are recommended to take a look at the weekly chart. Long-term Yelp price action justifies a long position, given the 2-year-old support level at $50. The round number also helps point out the support’s strength. Although the entry might come a bit late, the high reward would appeal to position traders.

How I’d trade Yelp: I’d buy Yelp shares at $58 with a ten dollar stop loss. Profit target could be set at either $85 or close to all-time high ($100). Question is whether we are patient enough to hold this position for months to come.

