

The crude oil prices rose 12 percent during the last two weeks of trading, from recent low at 46.66 to about 52 dollars today. The crude oil futures rally might show the beginning of its recovery for higher prices. Is that a sign of the plunge’s end?
Oil Prices Plunge
At June 2014, just eight months ago, oil traded for more than $105 a barrel. The oil prices tanked more than 60 percent and hit the lowest level since 2009. In this article, we’ll look at the factors behind the slide and try to figure if it’s an opportunity to buy or just a temporary positive retracement that will end soon.
Global Factors
According to the International Energy Agency (IEA), the global crude oil output reached a new record high of 78.9 mb/d in December. The estimate was 78.2 mb/d, while the demand growth remained weak in the worldwide slowdown economy.
The decisions made by the Organization of the Petroleum Exporting Countries (OPEC), is an important factor that affects oil prices. OPEC’s oil exports represent about 60 percent of the total oil market. Saudi Arabia is the OPEC’s largest oil producer. Because of this market share, OPEC’s actions has an enormous influence on international oil prices. For instance, by cutting its own production, it will increase oil prices by reducing the global supply.
Yet OPEC decided to keep its production target unchanged. It seems that OPEC won’t cut the oil production to force the US’ shale producers out of the market due to high costs.
U.S. output increased 70 percent in the past five years. Oil producers used the U.S. shale that combines the horizontal drilling with hydraulic fracturing technologies. The shale oil is hurting the global oil producers and exporting companies by increasing the supply and reducing the demand. That, of course, leads to the plunge of oil prices.
Political Interest
Russia is one of the world’s largest oil producers as the Oil and Gas sales account for nearly 70 percent of Russia’s exports revenue. The World Bank has warned that Russia’s economy would shrink by at least 0.7% in 2015 if oil prices won’t rise.
Conspiracy theorists think that U.S. oil companies and OPEC refuse to cut the oil’s global production to depress Russia’s economy over Ukrainian crisis.
USA and European Union implemented sanctions against Russia, in response to Russia’s invasion of Ukraine. Yet, Russia has lost “only” $40 billion a year from these Western sanctions. Oil prices falling did the most damage to Russian’s economy, costing $ 90 billion a year.
Crude Oil Forecast By Technical Analysis
The following chart pattern clearly shows the crude oil’s recent downtrend. Only a few indicators point to an end of the downtrend and a reversal.
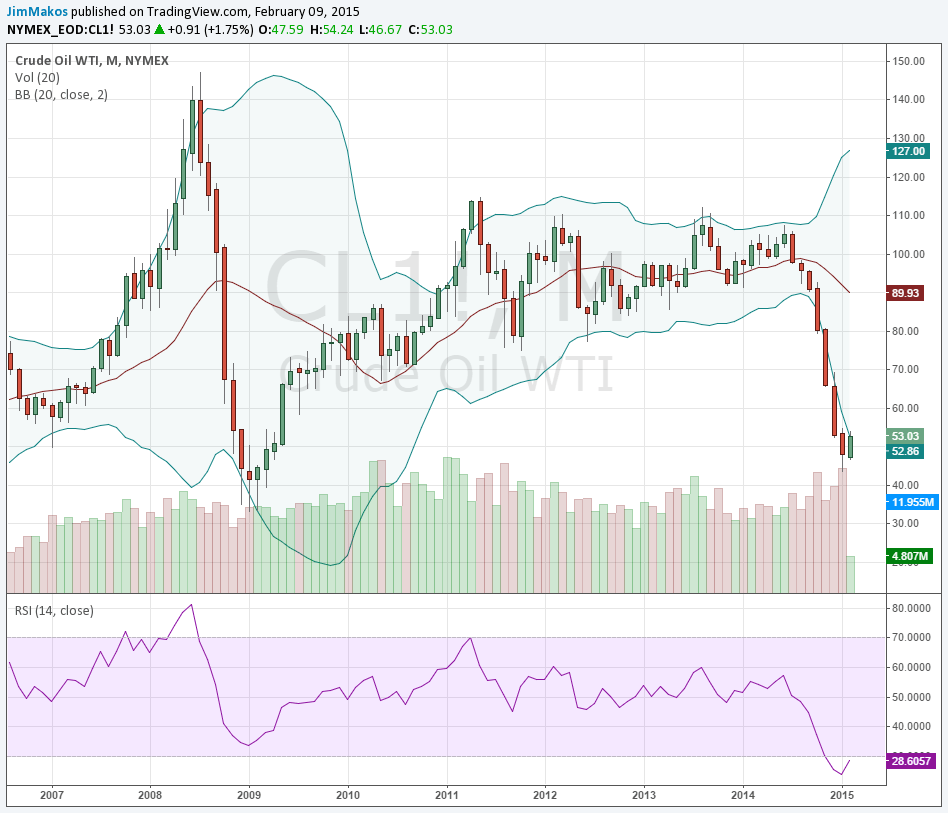
In short term, we predict that oil prices are facing up towards the $75 level. This retracement, if it happens, is likely to take place over the next couple of months or so. Then we’ll have to wait and see whether it will try to test the $100 price mark or even retest previous resistance at $110 level, although too unlikely.
Bollinger Bands suggest a buy signal. As shown on the chart the oil price pulled back from lower Bollinger band. It’s now moving up to the middle Bollinger band at 89.90 level.
The second important indicator is the Relative Strength Index (RSI), a technical momentum indicator. RSI ranges from 0 to 100. If RSI approaches the 70 level, the asset may be getting overvalued and is a good candidate for a pullback. Values below 30 show an oversold situation, like here. Oil price has fallen a lot over time, and most likely will correct upwards.
In summary, buy signals according to key indicators (RSI, Bollinger Bands) have been strong. Trading long in the following weeks sounds logical, until the slightest hint of the correction’s termination prints on chart. Who can rule out oil price plummeting even lower to retest the 2008 support level?
Featured image via Flickr

